Back to Main Page
Analysis of the "Flash Crash"
Date of Event: 20100506
Part 1, The Events
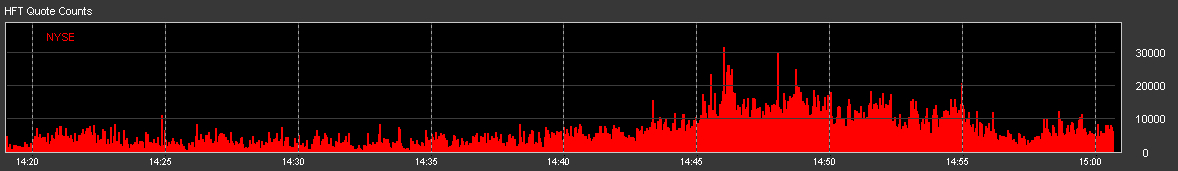
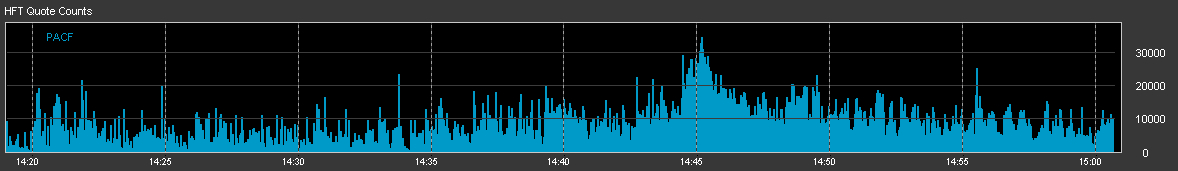
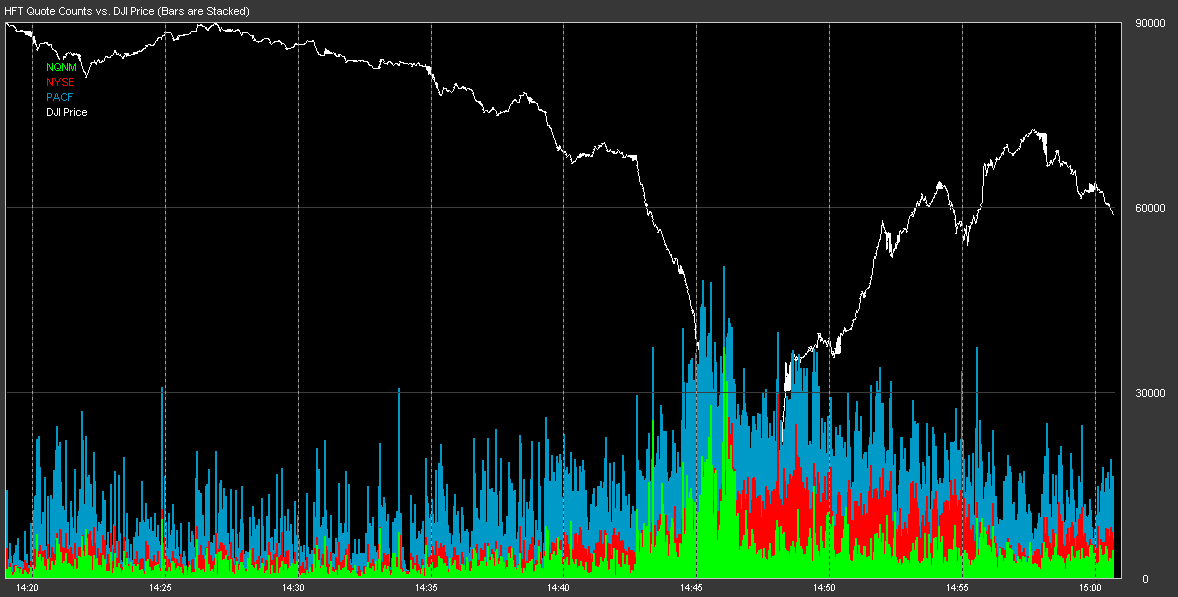
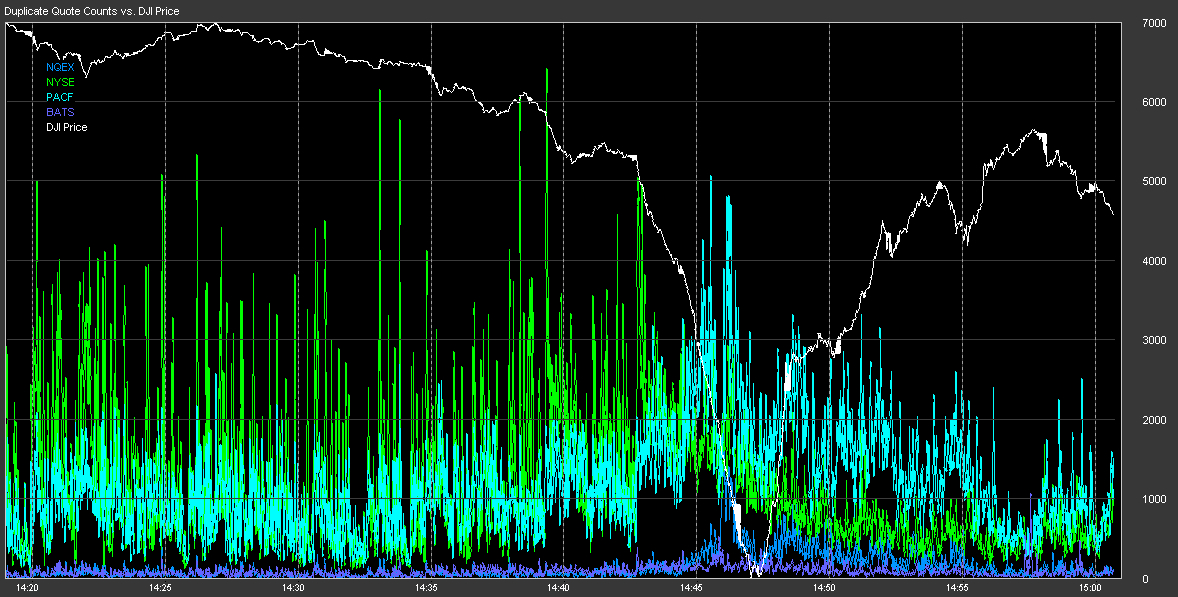
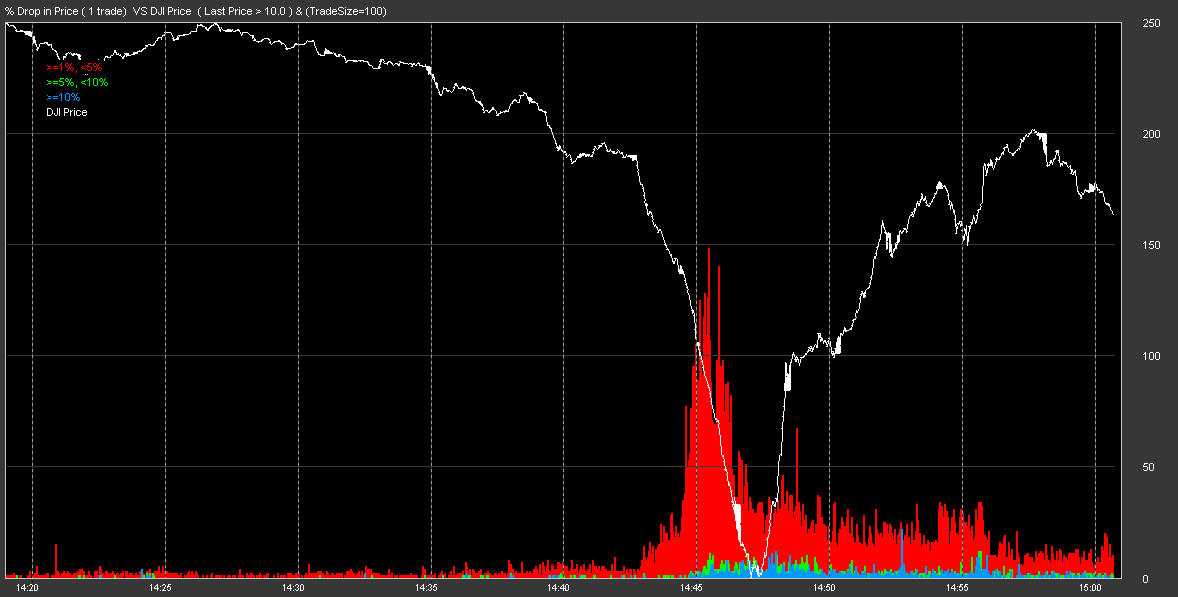
| We have chosen the charting time frame below as we feel it gives the most comprehensive view of the events. We have constructed additional views of these charts on separate pages. For a Close-Up view Click Here and for a Full-Day view Click Here. |
| There are 9 exchanges that route orders to NYSE listed stocks: NYSE,
Nasdaq, ISE, BATS, Boston, Cincinnati (National Stock Exchange), CBOE,
ARCA and Chicago. Each exchange submits a bid and/or offer price for each stock
they wish to make a market in. The highest bid price becomes the National Best
Bid and the lowest offer price becomes the National Best Ask. Exchanges
compete, fiercely at times, to become the best bid or offer because that is
where orders will be sent for execution. Exchanges also go to great lengths to
ensure they avoid crossing other exchanges (bidding higher than others are
offering, or offering lower than others are bidding), because if they do,
many High Frequency Trading (HFT) systems will immediately execute a
buy/offer and capture an immediate profit equal to the difference. Today, it is
very rare to see markets crossed in stocks for longer than a few
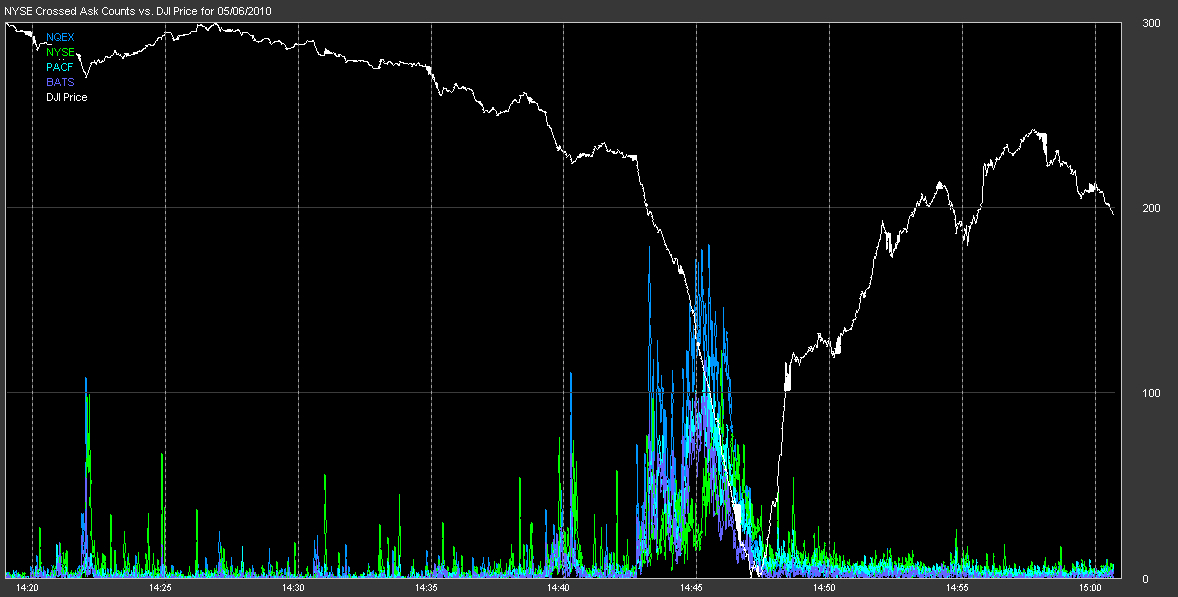
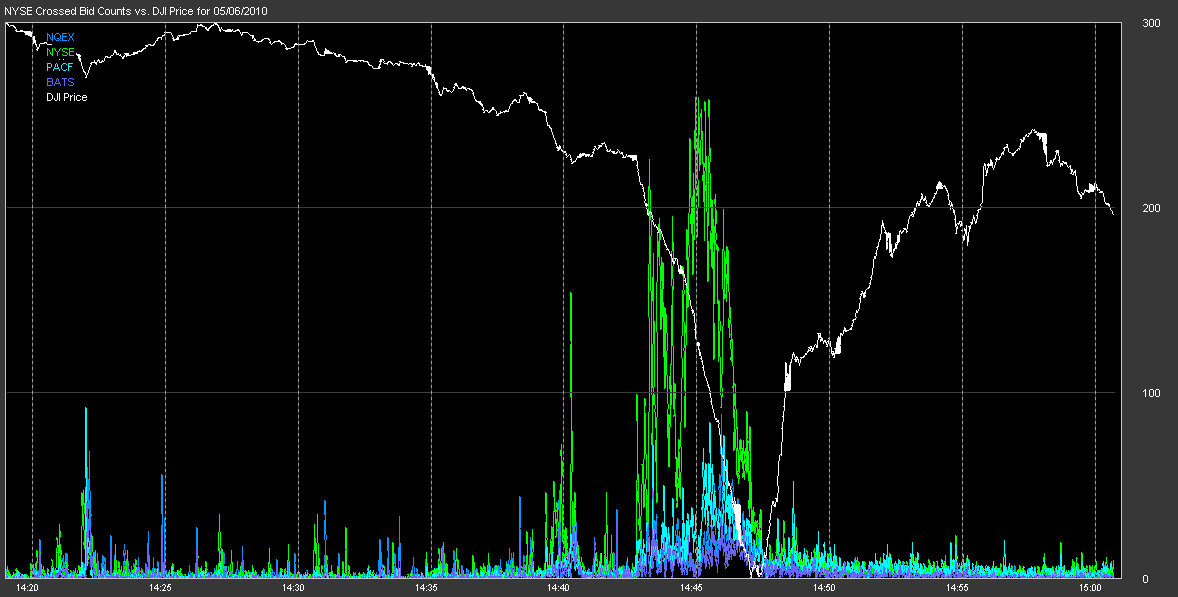
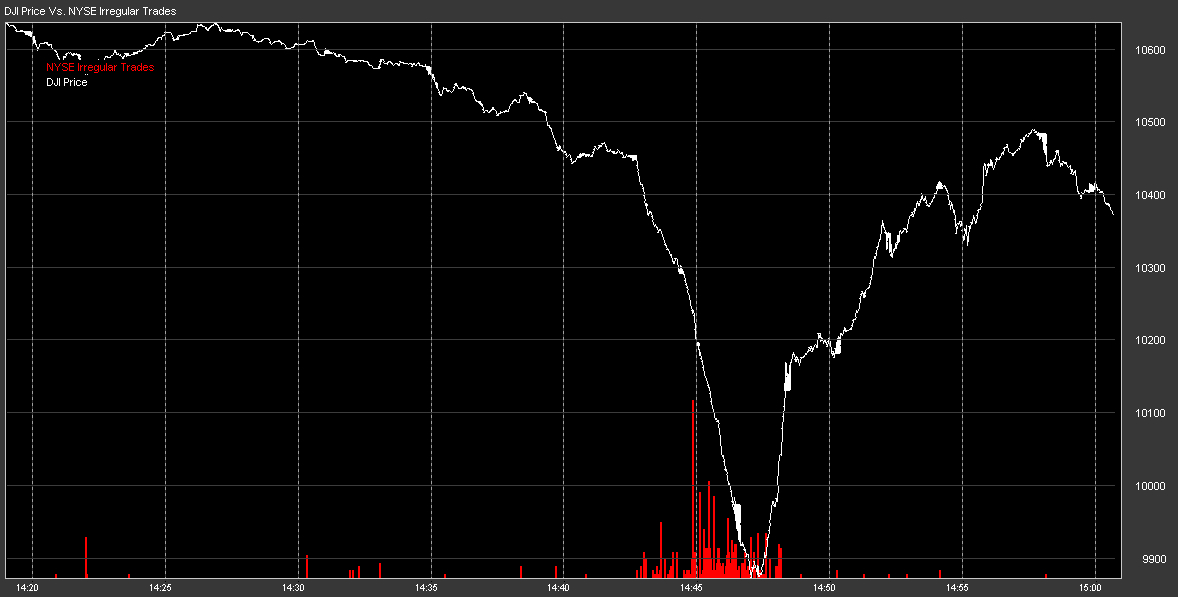
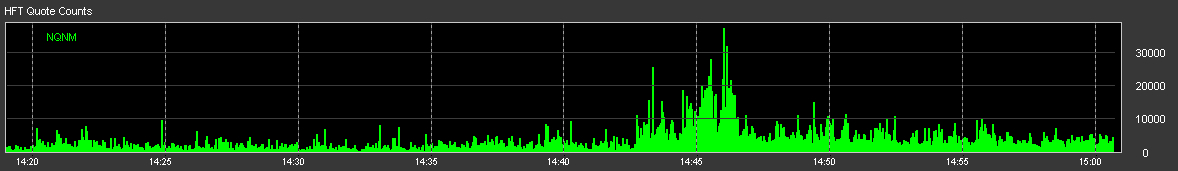
milliseconds. Beginning at 14:42:46, bids from the NYSE started crossing above the National Best Ask prices in about 100 NYSE listed stocks, expanding to over 250 stocks within 2 minutes (See Chart 1-b). Detailed inspection indicates NYSE quote prices started lagging quotes from other markets; their bid prices were not dropping fast enough to keep below the other exchange's falling offer prices. The time stamp on NYSE quotes matched that of other exchange quotes, indicating they were valid and fresh. With NYSE's bid above the offer price at other exchanges, HFT systems would attempt to profit from this difference by sending buy orders to other exchanges and sell orders to the NYSE. Hence the NYSE would bear the brunt of the selling pressure for those stocks that were crossed. Minutes later, trade executions from the NYSE started coming through in many stocks at prices slightly below the National Best Bid, setting new lows for the day. (See Chart 2). This is unexpected, the execution prices from the NYSE should have been higher -- matching NYSE's higher bid price, unless the time stamps are not reflecting when quotes and trades actually occurred. If the quotes sent from the NYSE were stuck in a queue for transmission and time stamped ONLY when exiting the queue, then all data inconsistencies disappear and things make sense. In fact, this very situation occurred on 2 separate occasions at NYSE: October 30, 2009, and again on January 28, 2010. (View Previous Occurrences). Charting the bid/ask cross counts for those two days reveals the same pattern as 5/6! Looking at the details of the trade and quote data on those days shows the same time stamp/price inconsistencies. The NYSE stated that during the same intervals, they were experiencing delays in disseminating their quotes! In summary, quotes from NYSE began to queue, but because they were time stamped after exiting the queue, the delay was undetectable to systems processing those quotes. On 05/06/2010 the delay was enough to cause the NYSE bid to be just slightly higher than the lowest offer price from competing exchanges, but small enough that it was difficult to detect. This caused sell order flow to route to NYSE -- thus removing any buying power that existed on other exchanges. When these sell orders arrived at NYSE, the actual bid price was lower because new lower quotes were still waiting to exit a queue for dissemination. This situation led to orders executing against whatever buy orders existed in the NYSE designated market maker (DMM) order book. When an order is executed, the trade is reported to a different system (CTS) than quotes (CQS). Since trade report traffic is much smaller than quote traffic, there is rarely any queueing or delay. Because many of the stocks involved were high capitalization bellwether stocks and represented a wide range of industries, and because quotes and trades from the NYSE are given higher credibility in many HFT systems, when the results of these trades were published, the HFT systems detected the sudden price drop and automatically went short, betting on capturing the developing downward momentum. This caused a short term feed-back loop to develop and panic ensued. Some trading firms have stated that they detected a problem with the accuracy of the data feed and decided to shut down which further reduced liquidity. We think the delay in NYSE quotes was at the root of this detection. |